1. Overview
The DeepSeek API Usage Analytics Dashboard is a purely browser-side data visualization tool. Simply drag your monthly CSV billing files exported from the DeepSeek Platform onto the page to instantly get:
- Cost Analysis: Total cost, daily cost trends, per API Key cost breakdown
- Usage Analysis: Total tokens, per-key usage details, request counts
- Cache Analysis: Cache hit rate, daily hit rate trends, per-key hits vs. misses comparison
- Trend Analysis: Freely switch between four metrics — cost / tokens / hit rate / requests
- Social Media Sharing: Generate infographic share images from each tab, one-click copy to WeChat/Feishu/DingTalk
Key Feature: All data parsing and chart rendering happens locally in your browser. CSV files are never uploaded to any server, ensuring your billing data privacy.
2. Quick Start
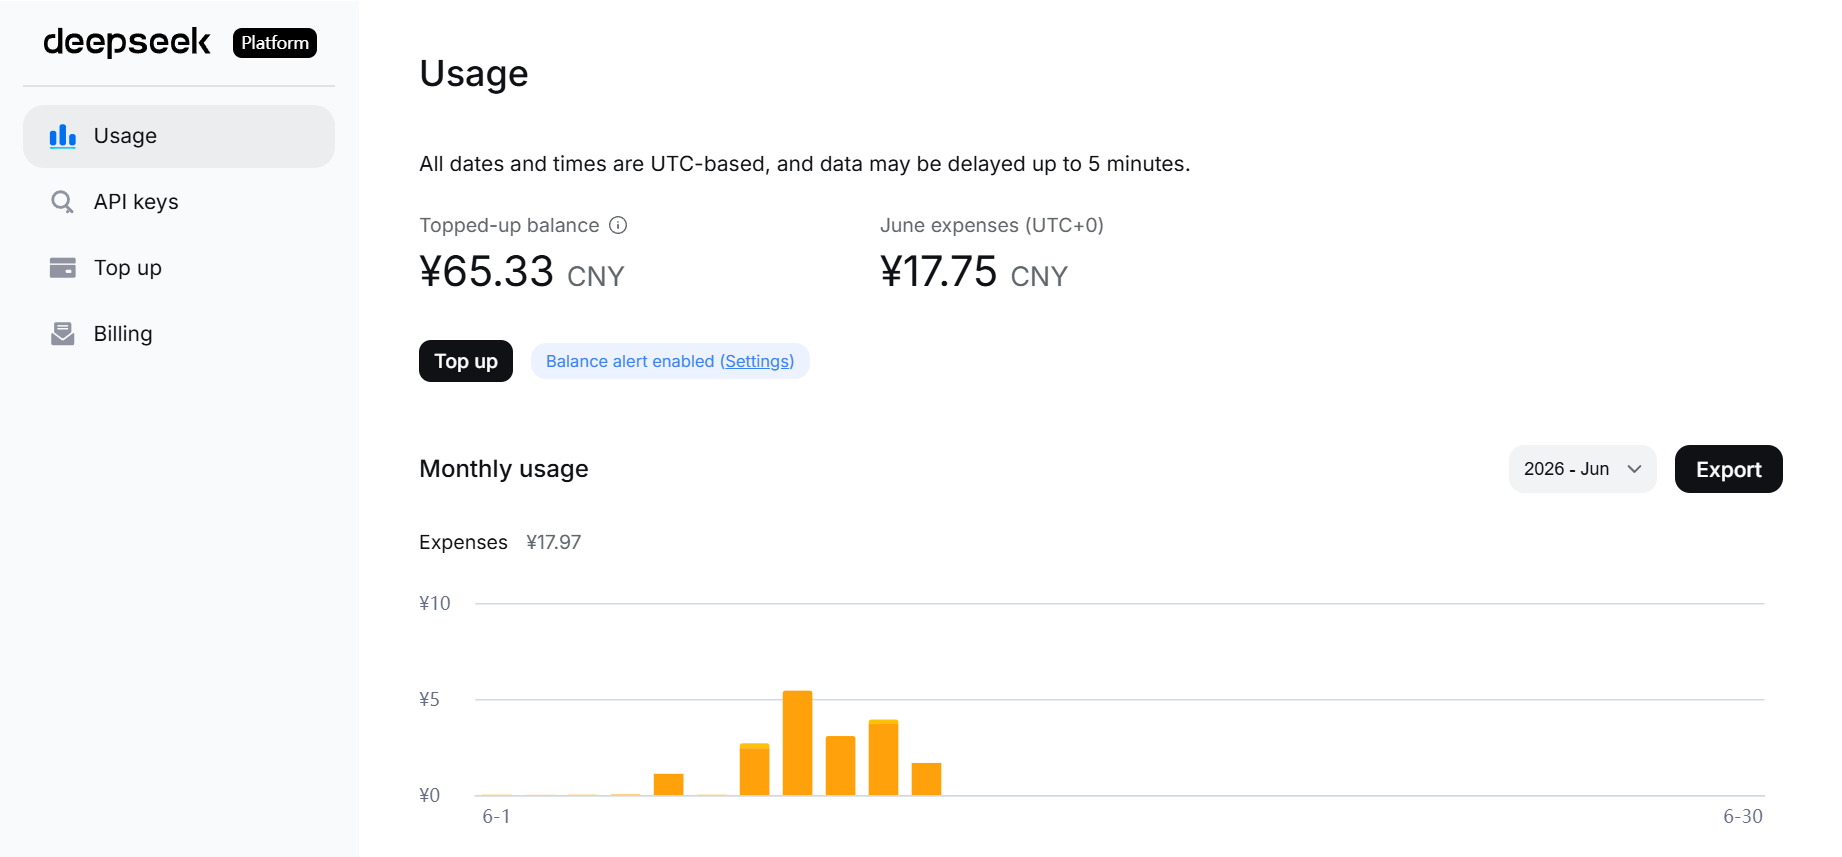
2.1 Export Data from DeepSeek Platform
- Log in to DeepSeek Platform
- Go to the "Usage" page
- Select the month you want to analyze, click "Export"
- Each month downloads a ZIP archive containing two CSV files:
amount-YYYY-M.csv— Usage details (tokens consumed, request counts, cache hit/miss data)cost-YYYY-M.csv— Cost details (daily cost data)
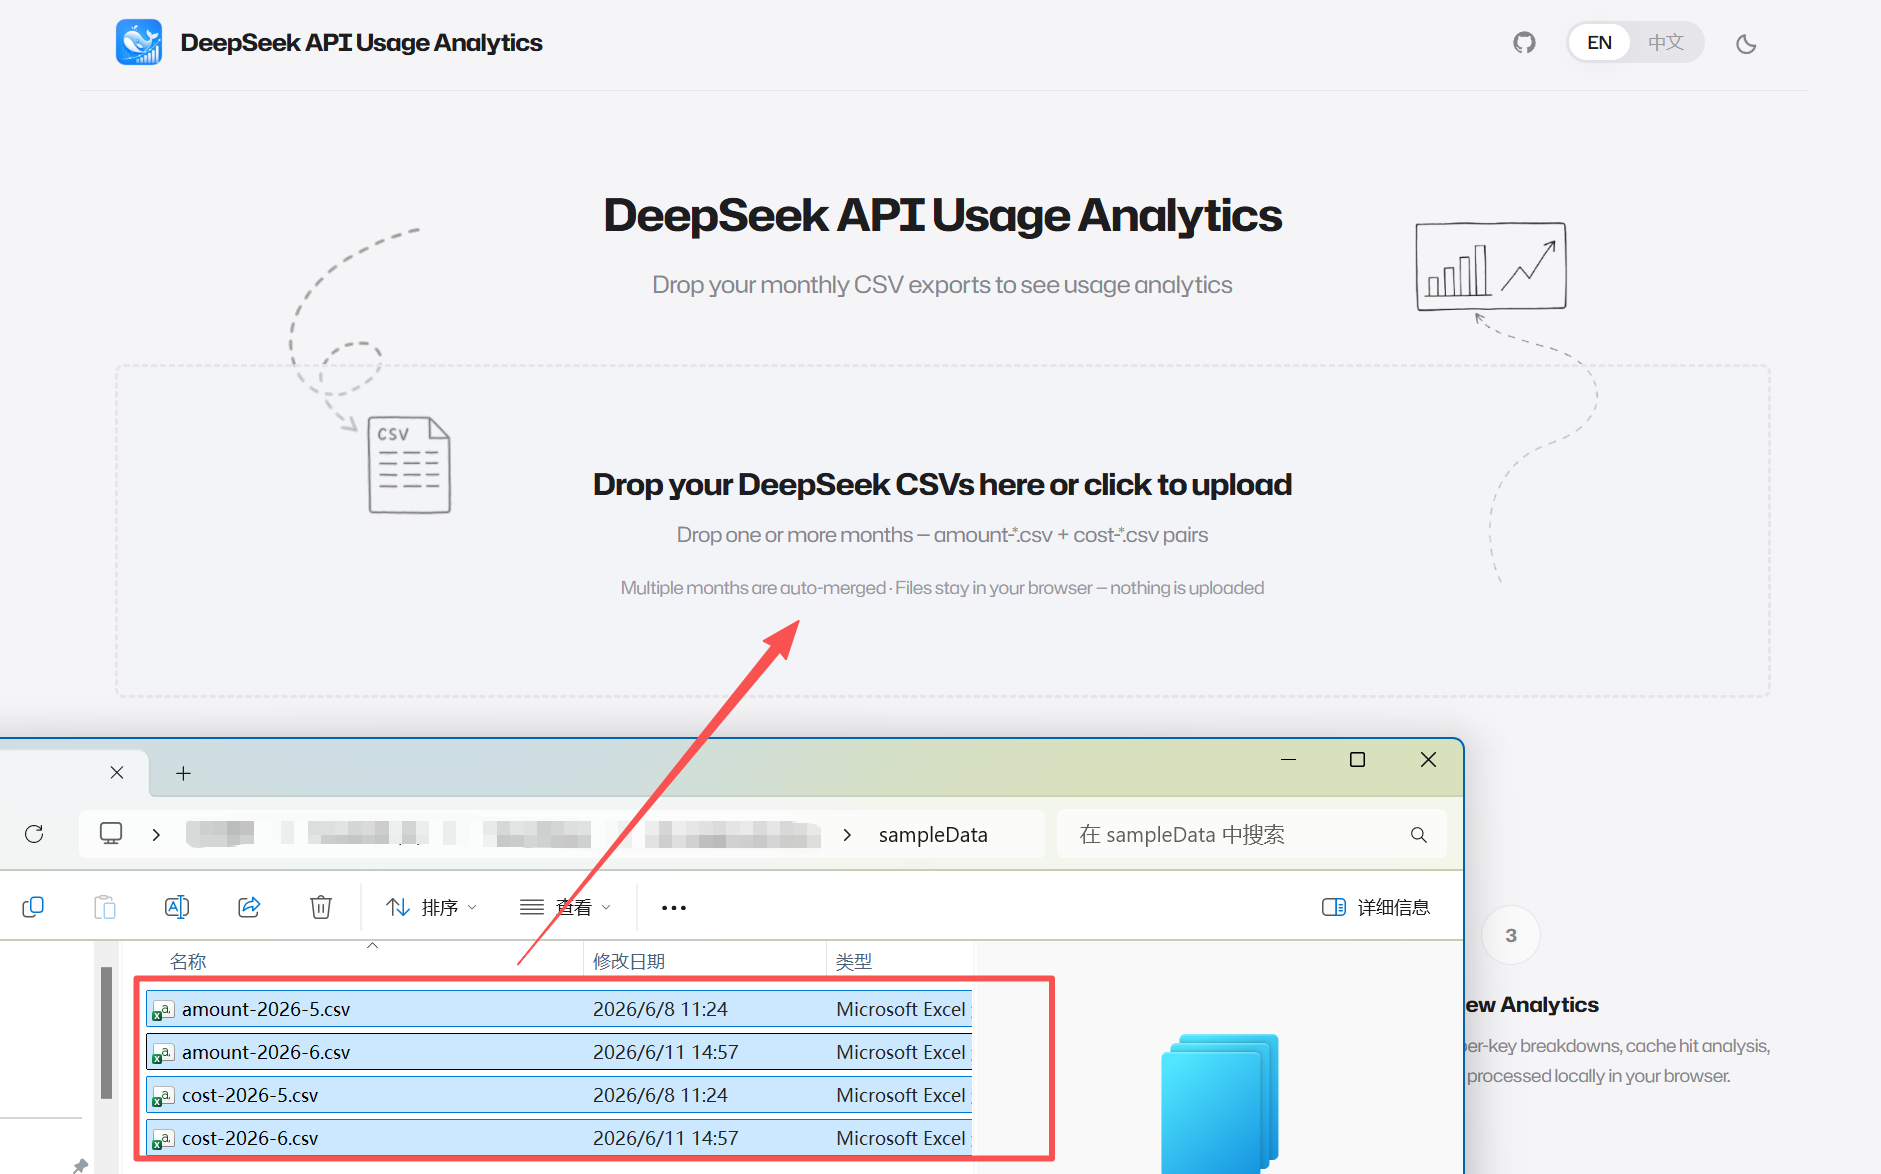
2.2 Upload Files
- Open the dashboard page (landing page by default)
- Drag the downloaded ZIP archive directly onto the upload area in the center of the page (no extraction needed)
- You can also drag extracted CSV files, or click the upload area to select files via the system file picker
- The upload area will show a "Processing CSV…" loading state
- Once processing is complete, the page automatically switches to the dashboard view
2.3 View Analytics
After upload completes, the page automatically displays:
- Top KPI cards (total cost, total tokens, cache hit rate, active API Keys)
- Switch between different analysis views via the tab bar below
- If multiple models are detected, use the model filter to view data for a specific model
3. Navigation Bar
The top navigation bar is fixed at the top of the page and shared between the landing page and dashboard views. It includes:
| Element | Description |
|---|---|
| Logo Icon | Dashboard app icon on the left |
| App Name | "DeepSeek API Usage Analytics" |
| GitHub Icon | Click to open the project's GitHub repository |
| Language Switcher | Apple-style pill segmented control, supports EN / 中文 |
| Theme Switcher | Sun/Moon icon button to toggle light/dark theme |
The navigation bar has a thin bottom border and floats above all content.
4. Dashboard Interface
After CSV files are successfully parsed, the page automatically switches from the landing page to the dashboard view.

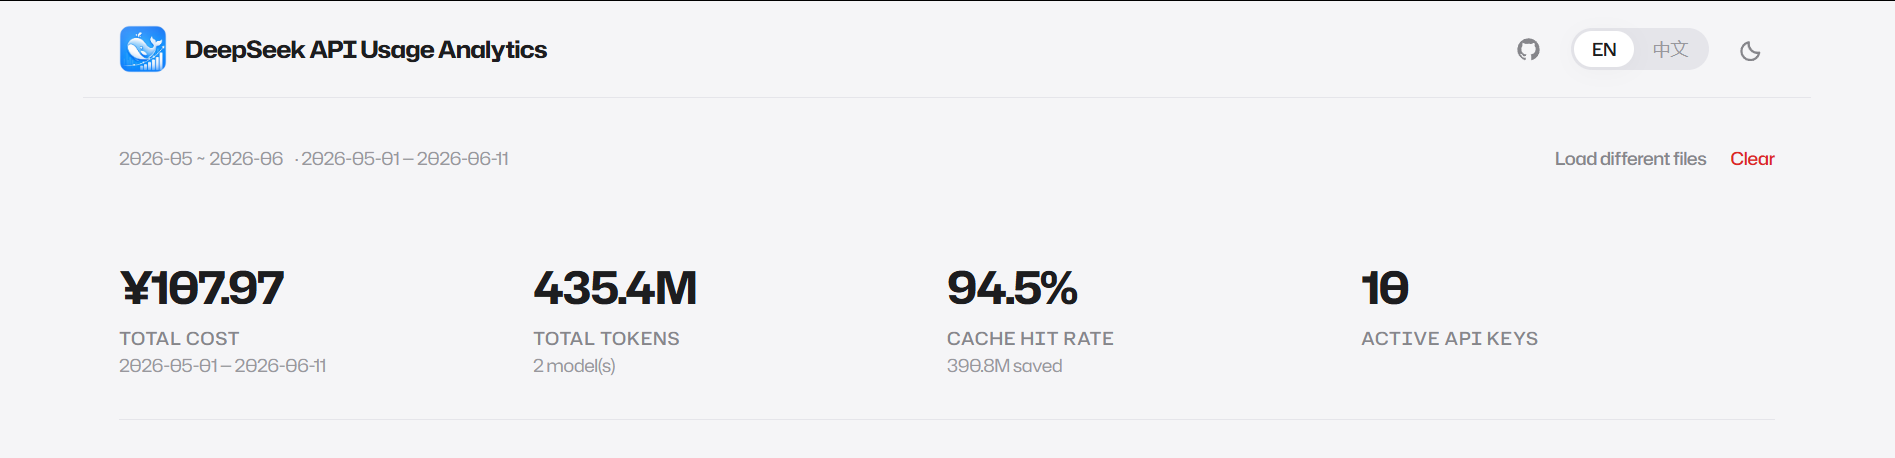
4.1 Action Bar
Located at the top of the page, with two sections:
Left — File Info:
- Displays the filename label (e.g.,
2026-5or2026-5 ~ 2026-6for multiple months) - Displays the date range (e.g.,
2026-05-01 — 2026-05-31)
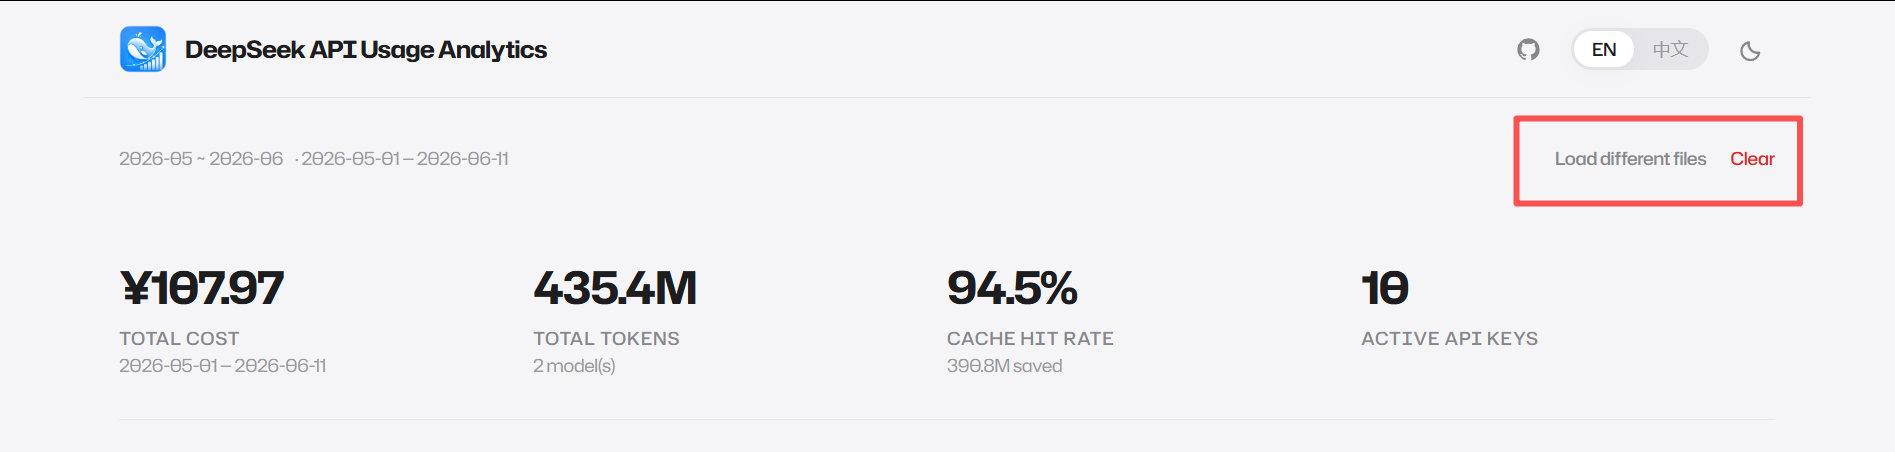
Right — Action Buttons:
- Load Different Files: Click to open the file picker and load new CSV files (replaces current data)
- Clear (red text): Clears all current data and returns to the landing page
4.2 Error and Warning Messages
Error Banners
Displayed when CSV parsing encounters critical errors, including:
- Error type title (e.g., "CSV Format Not Recognized", "CSV Parse Error", "Empty File", "Incomplete Upload")
- Detailed error description
- Row and column number where the error occurred (if applicable)
Visual style: light red background + red border + red text.
Warning Banners
Displayed when data has non-critical issues, each warning shown as an independent banner:
- Possible warning types: date mismatch, missing cost data, incomplete cache data, schema drift
Visual style: light amber background + amber border + amber text.
4.3 KPI Cards
"No-card" design: 4-column full-width large numbers + fine labels, separated by thin horizontal dividers.
| Metric | Content |
|---|---|
| Total Cost | Formatted currency amount, subtitle shows date range |
| Total Tokens | Formatted token count, subtitle shows model count |
| Cache Hit Rate | Percentage, subtitle shows tokens saved by cache |
| Active API Keys | Count, no subtitle |
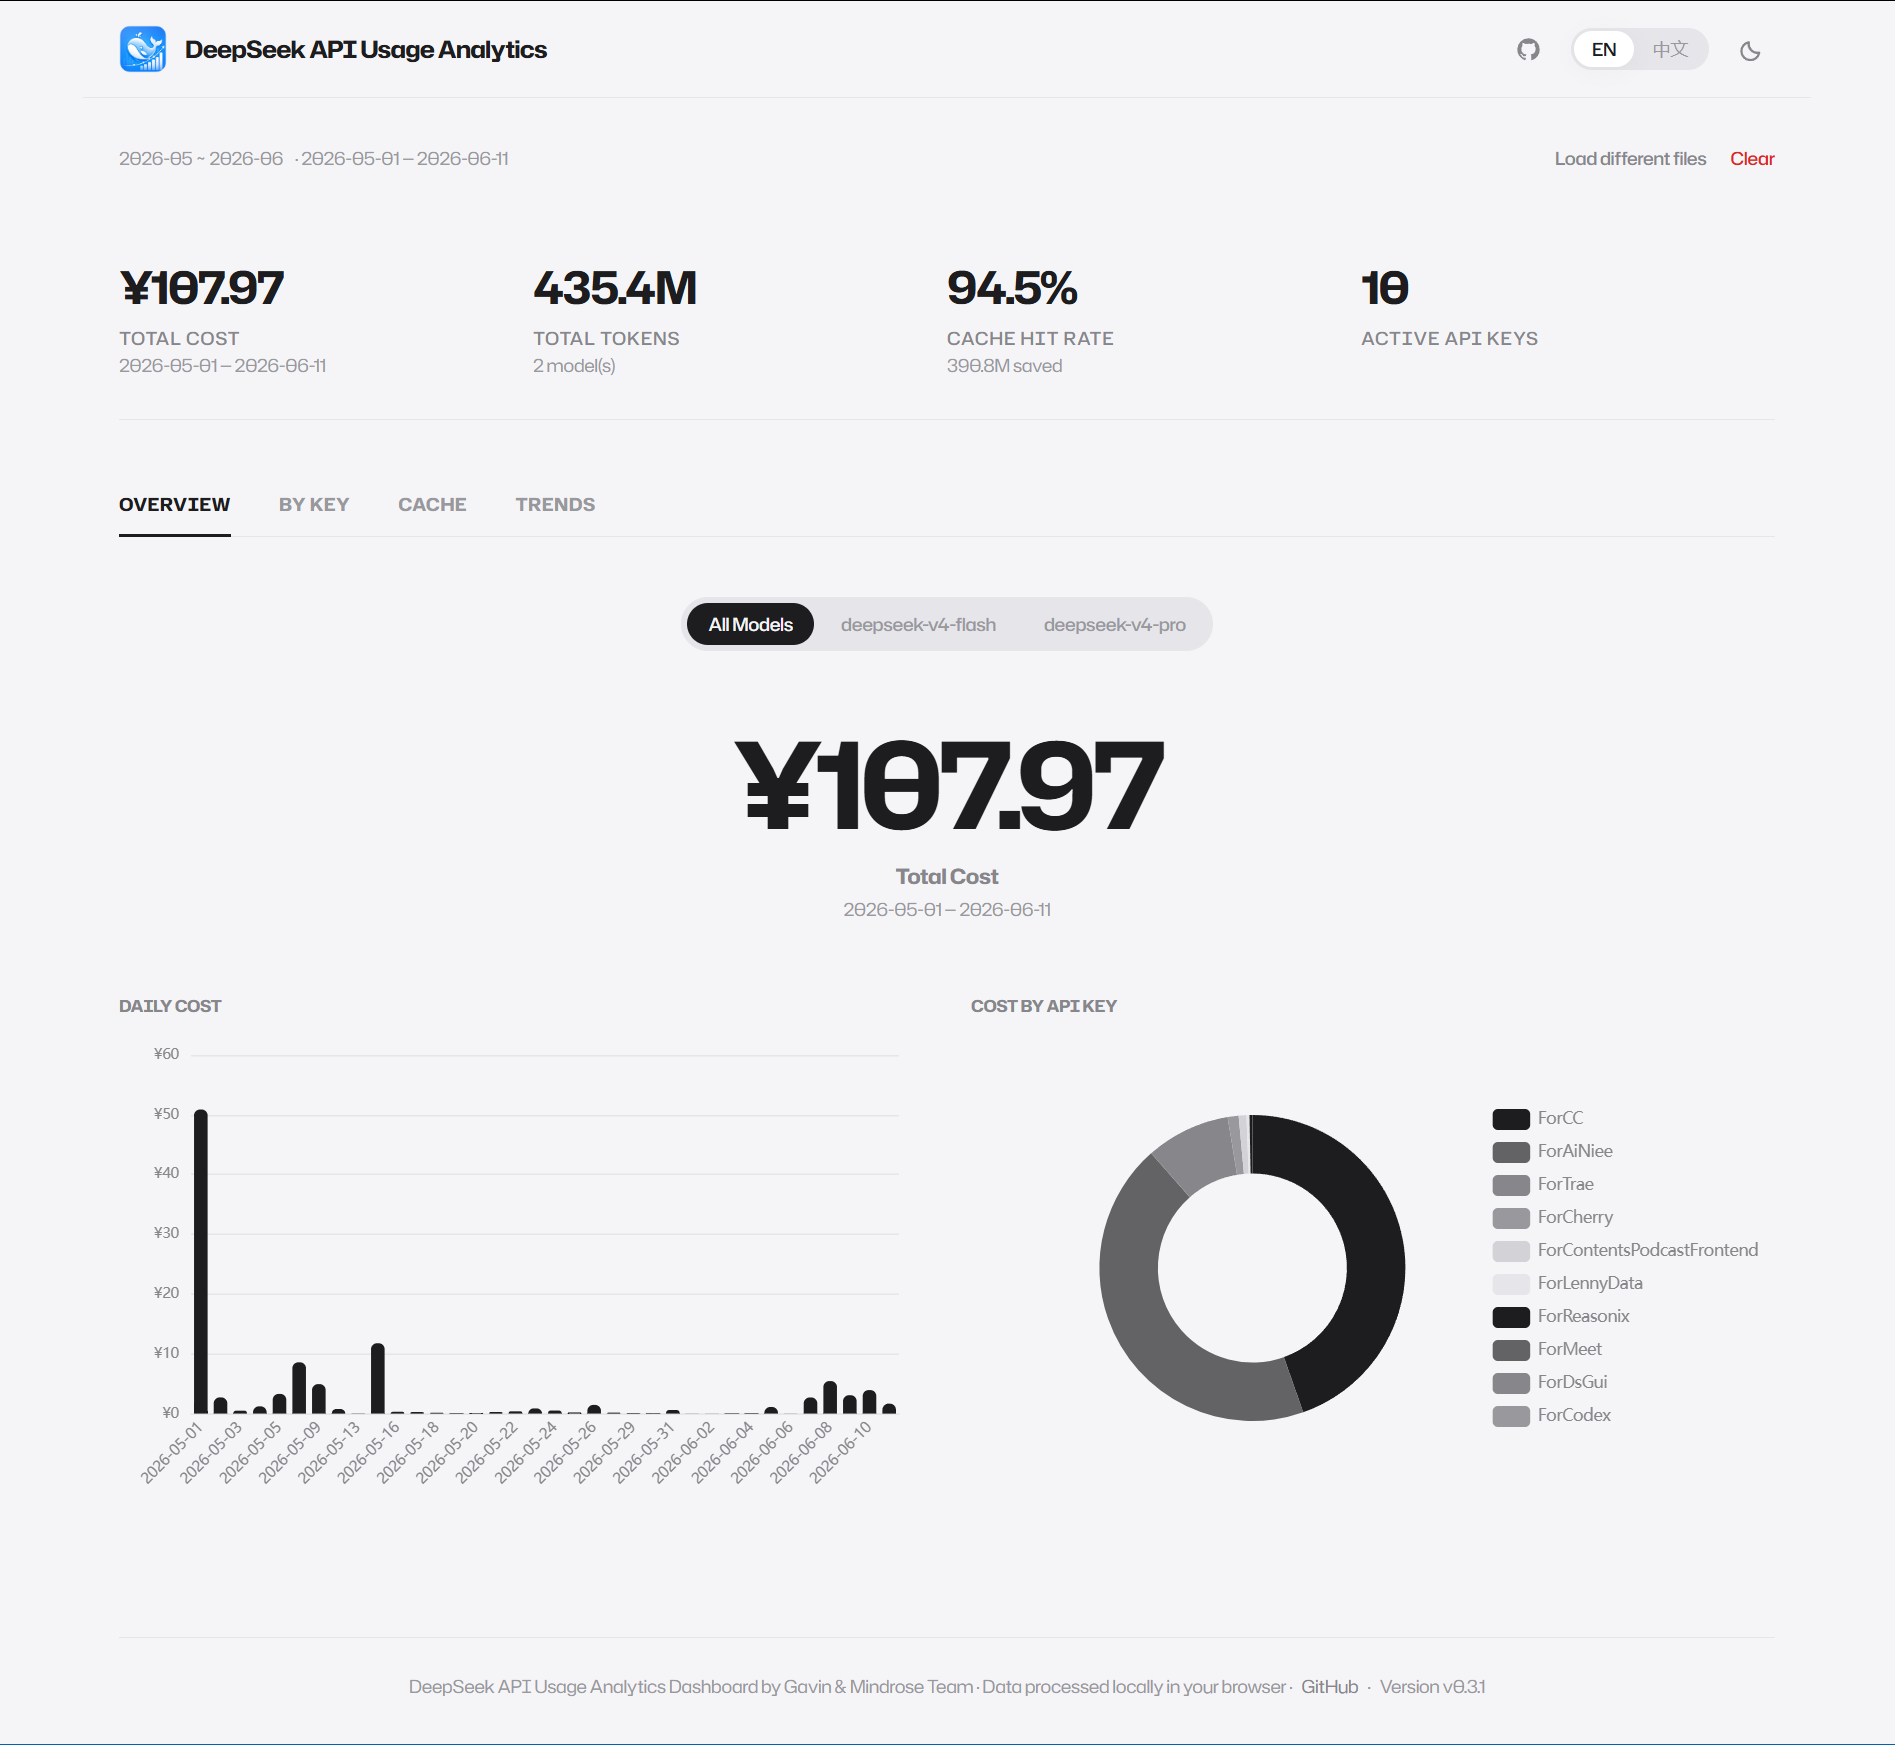
4.4 Tab Navigation and Model Filter
Tab Navigation
Apple-style underline tabs, 5 tabs:
| English | 中文 |
|---|---|
| Overview | 总览 |
| By Custom Projects | 按自定义项目 |
| By Key | 按 Key |
| Cache | 缓存 |
| Trends | 趋势 |
- Selected tab: 2px bottom border + primary text color
- Unselected tab: no bottom border + tertiary text color
- Smooth fade-in transition on tab switch
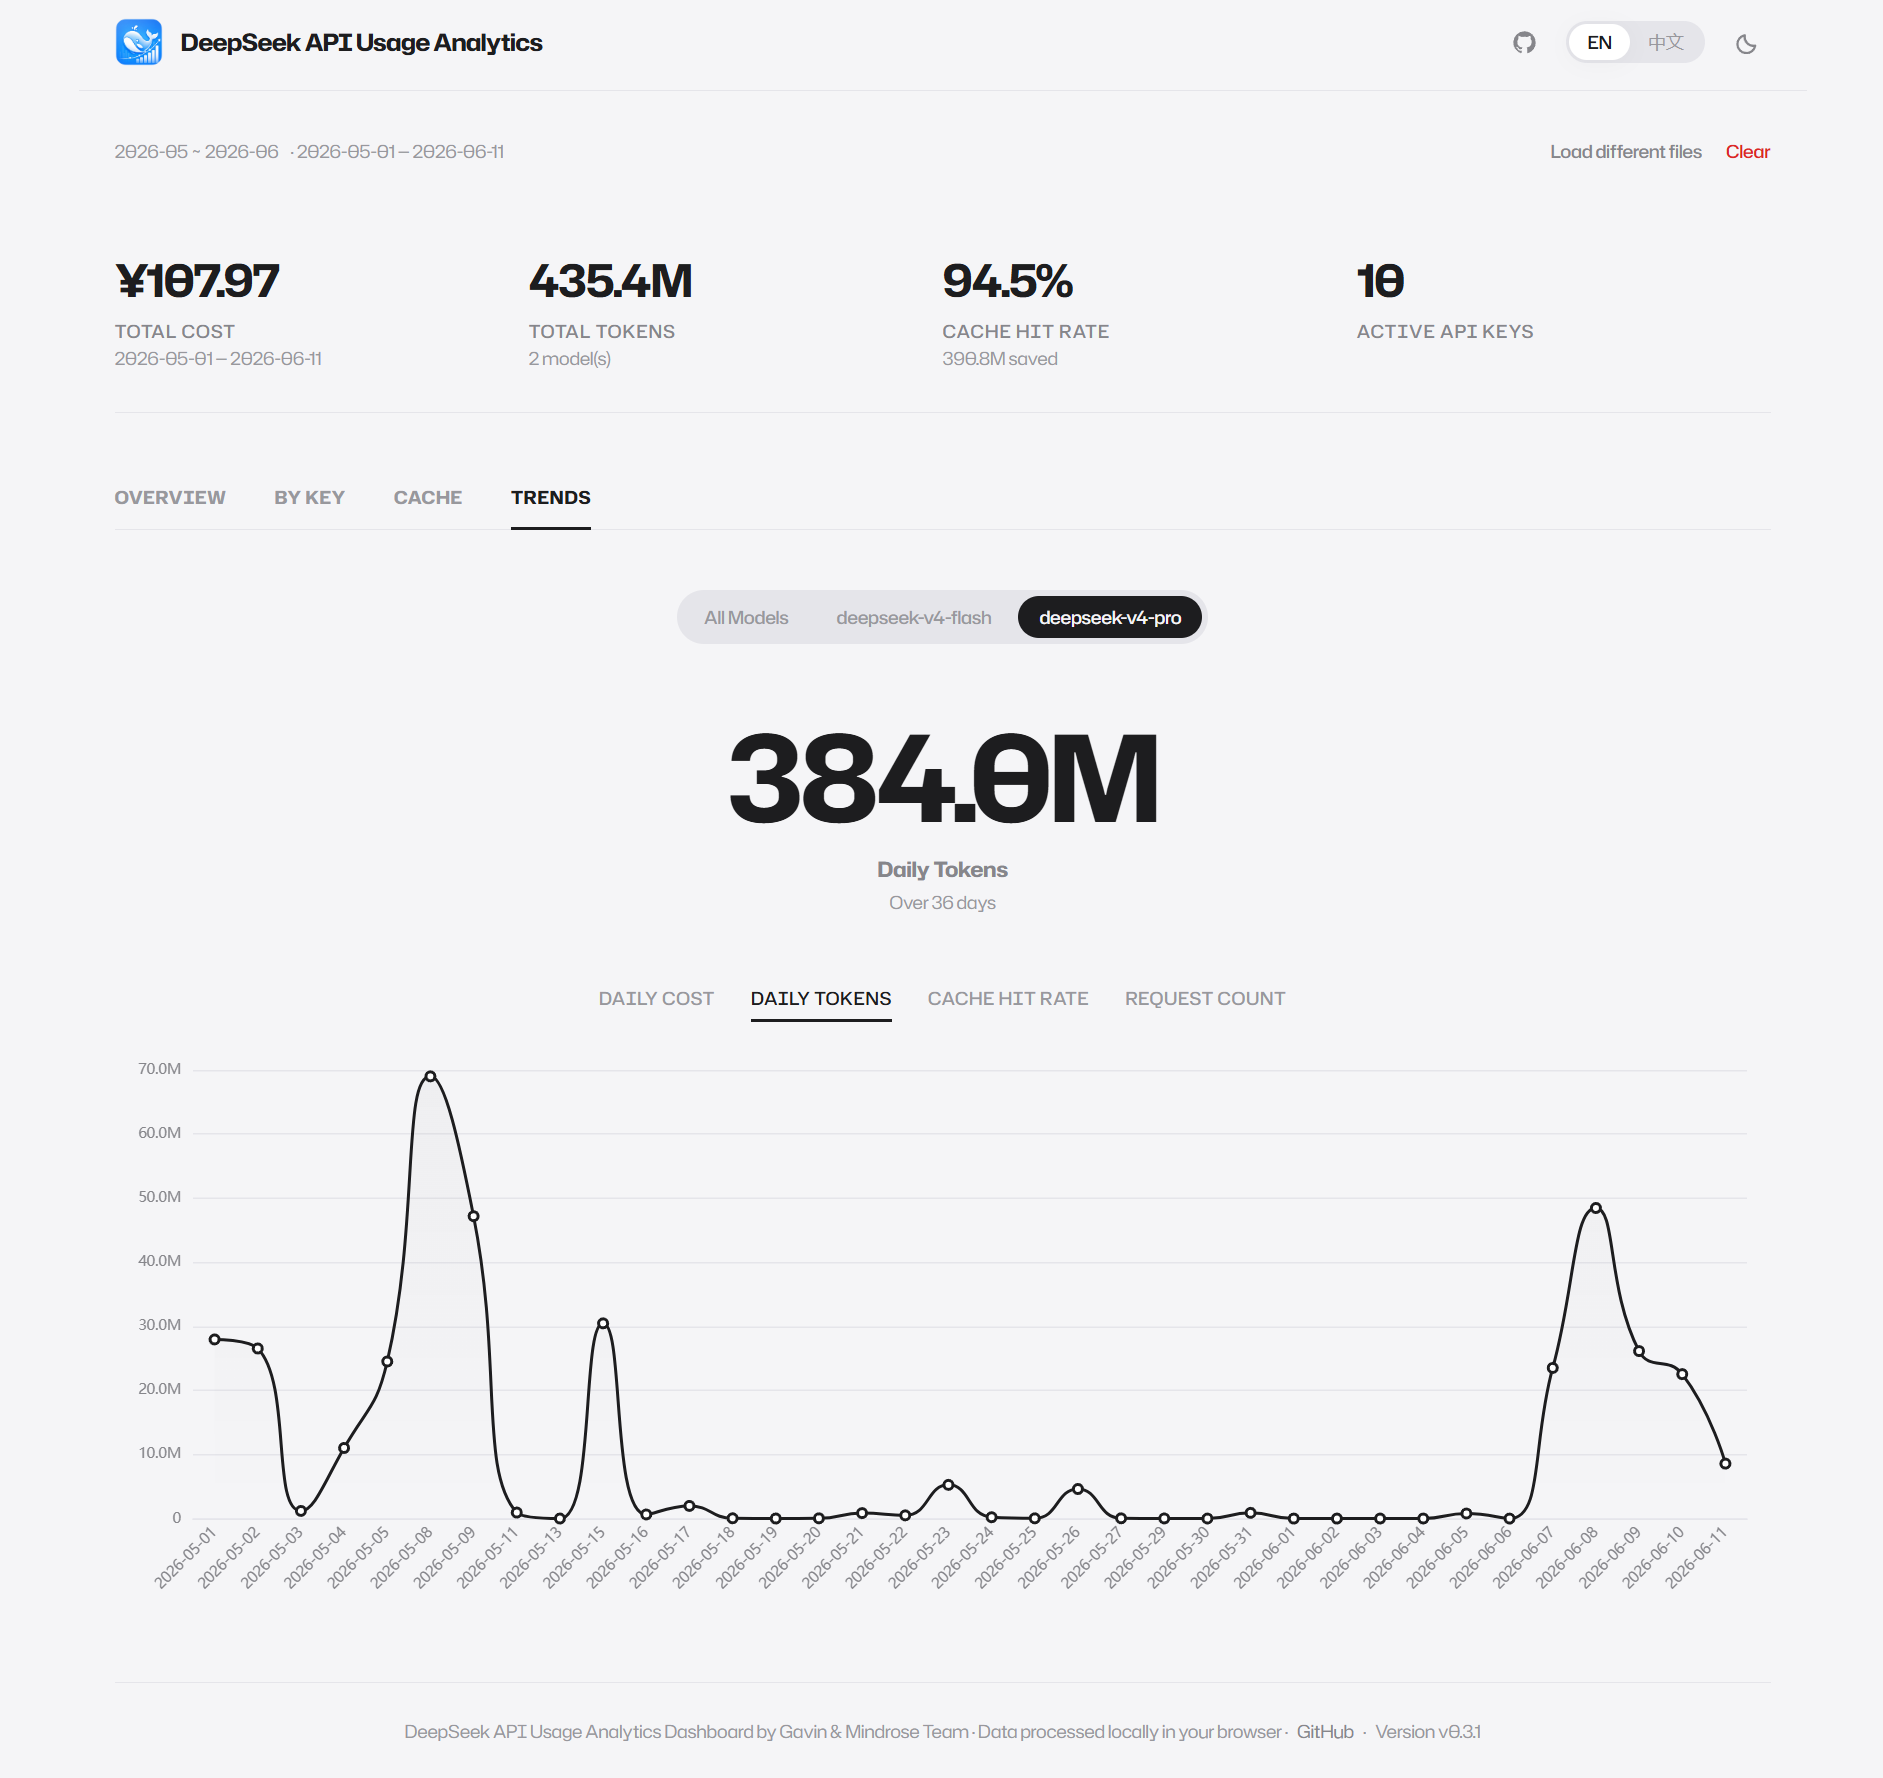
Model Filter
Automatically displayed when data contains 2 or more models. Apple-style pill segmented control:
- All Models: Default selection, shows merged data for all models
- Individual Model Name: Click to view data for that specific model
Visual: rounded pill group, selected item has dark fill + white text, unselected items have transparent background + gray text.
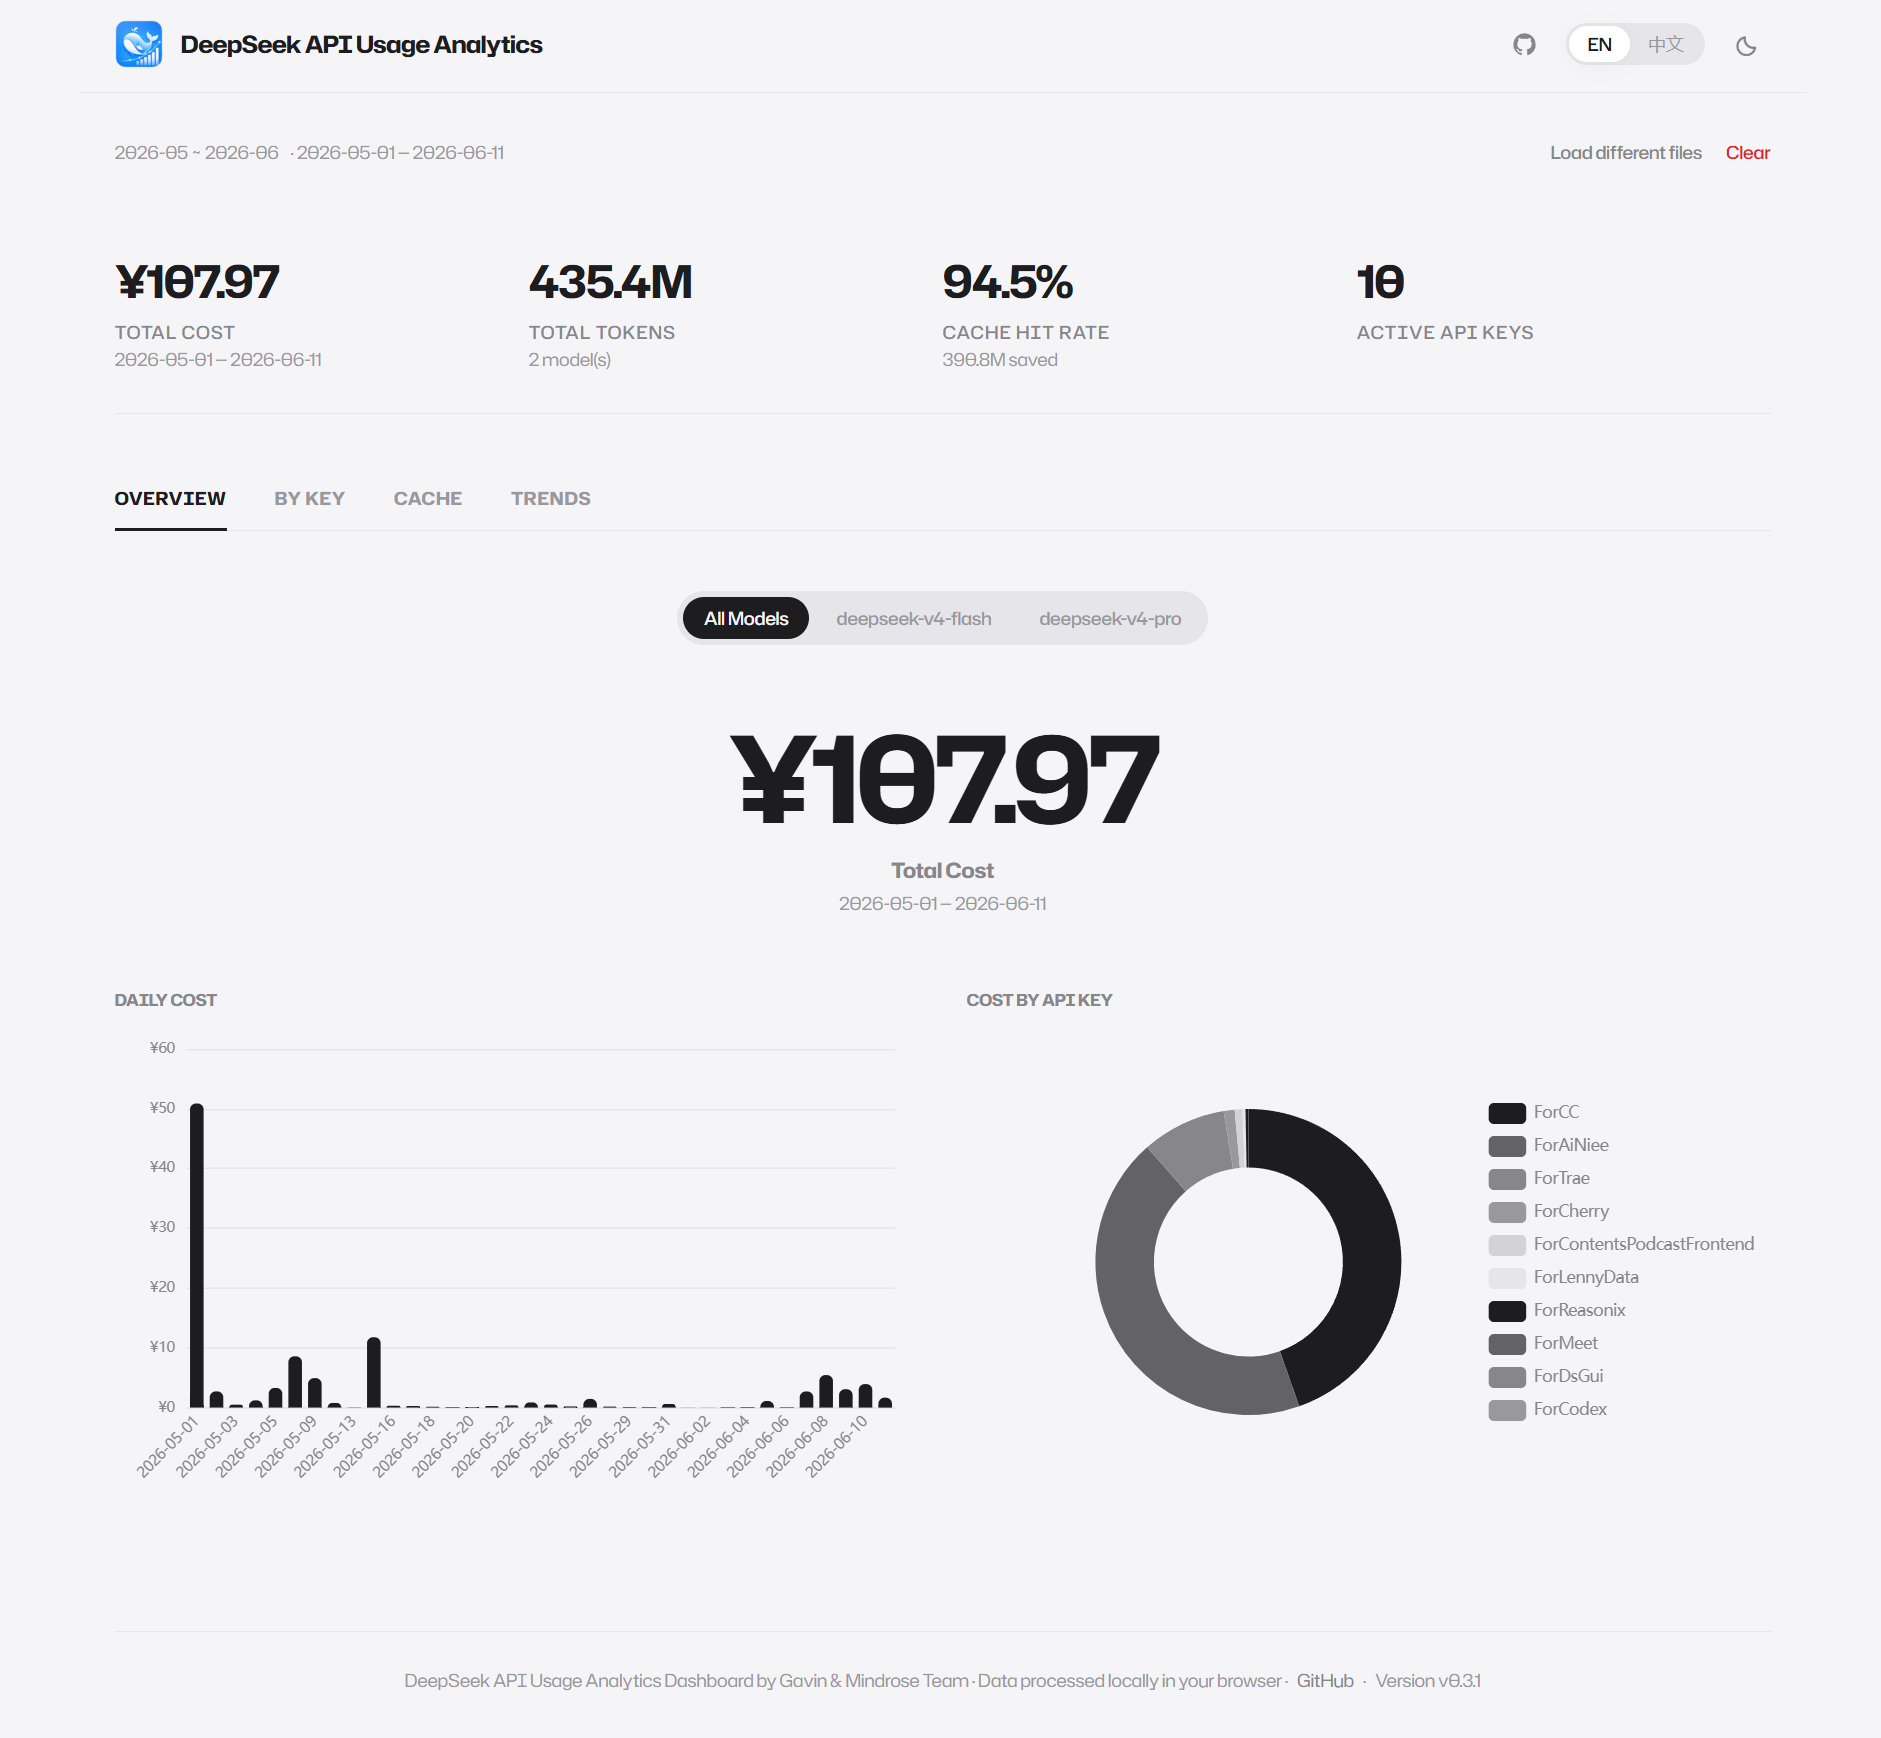
4.5 Overview View
Hero Number
- Large number: Extra-large bold total cost amount
- Label: "Total Cost"
- Date range: Time range covered by the data
Daily Cost Bar Chart
- Type: ECharts bar chart
- Content: Daily cost totals, dark bars with slightly rounded tops
- Interaction: hover tooltips (showing specific date and cost amount)
- X-axis labels auto-rotate when more than 15 days
Cost by Key Donut Chart
- Type: ECharts donut chart
- Content: Per API Key cost proportions
- Legend: vertically aligned on the right
- Interaction: hover highlights labels
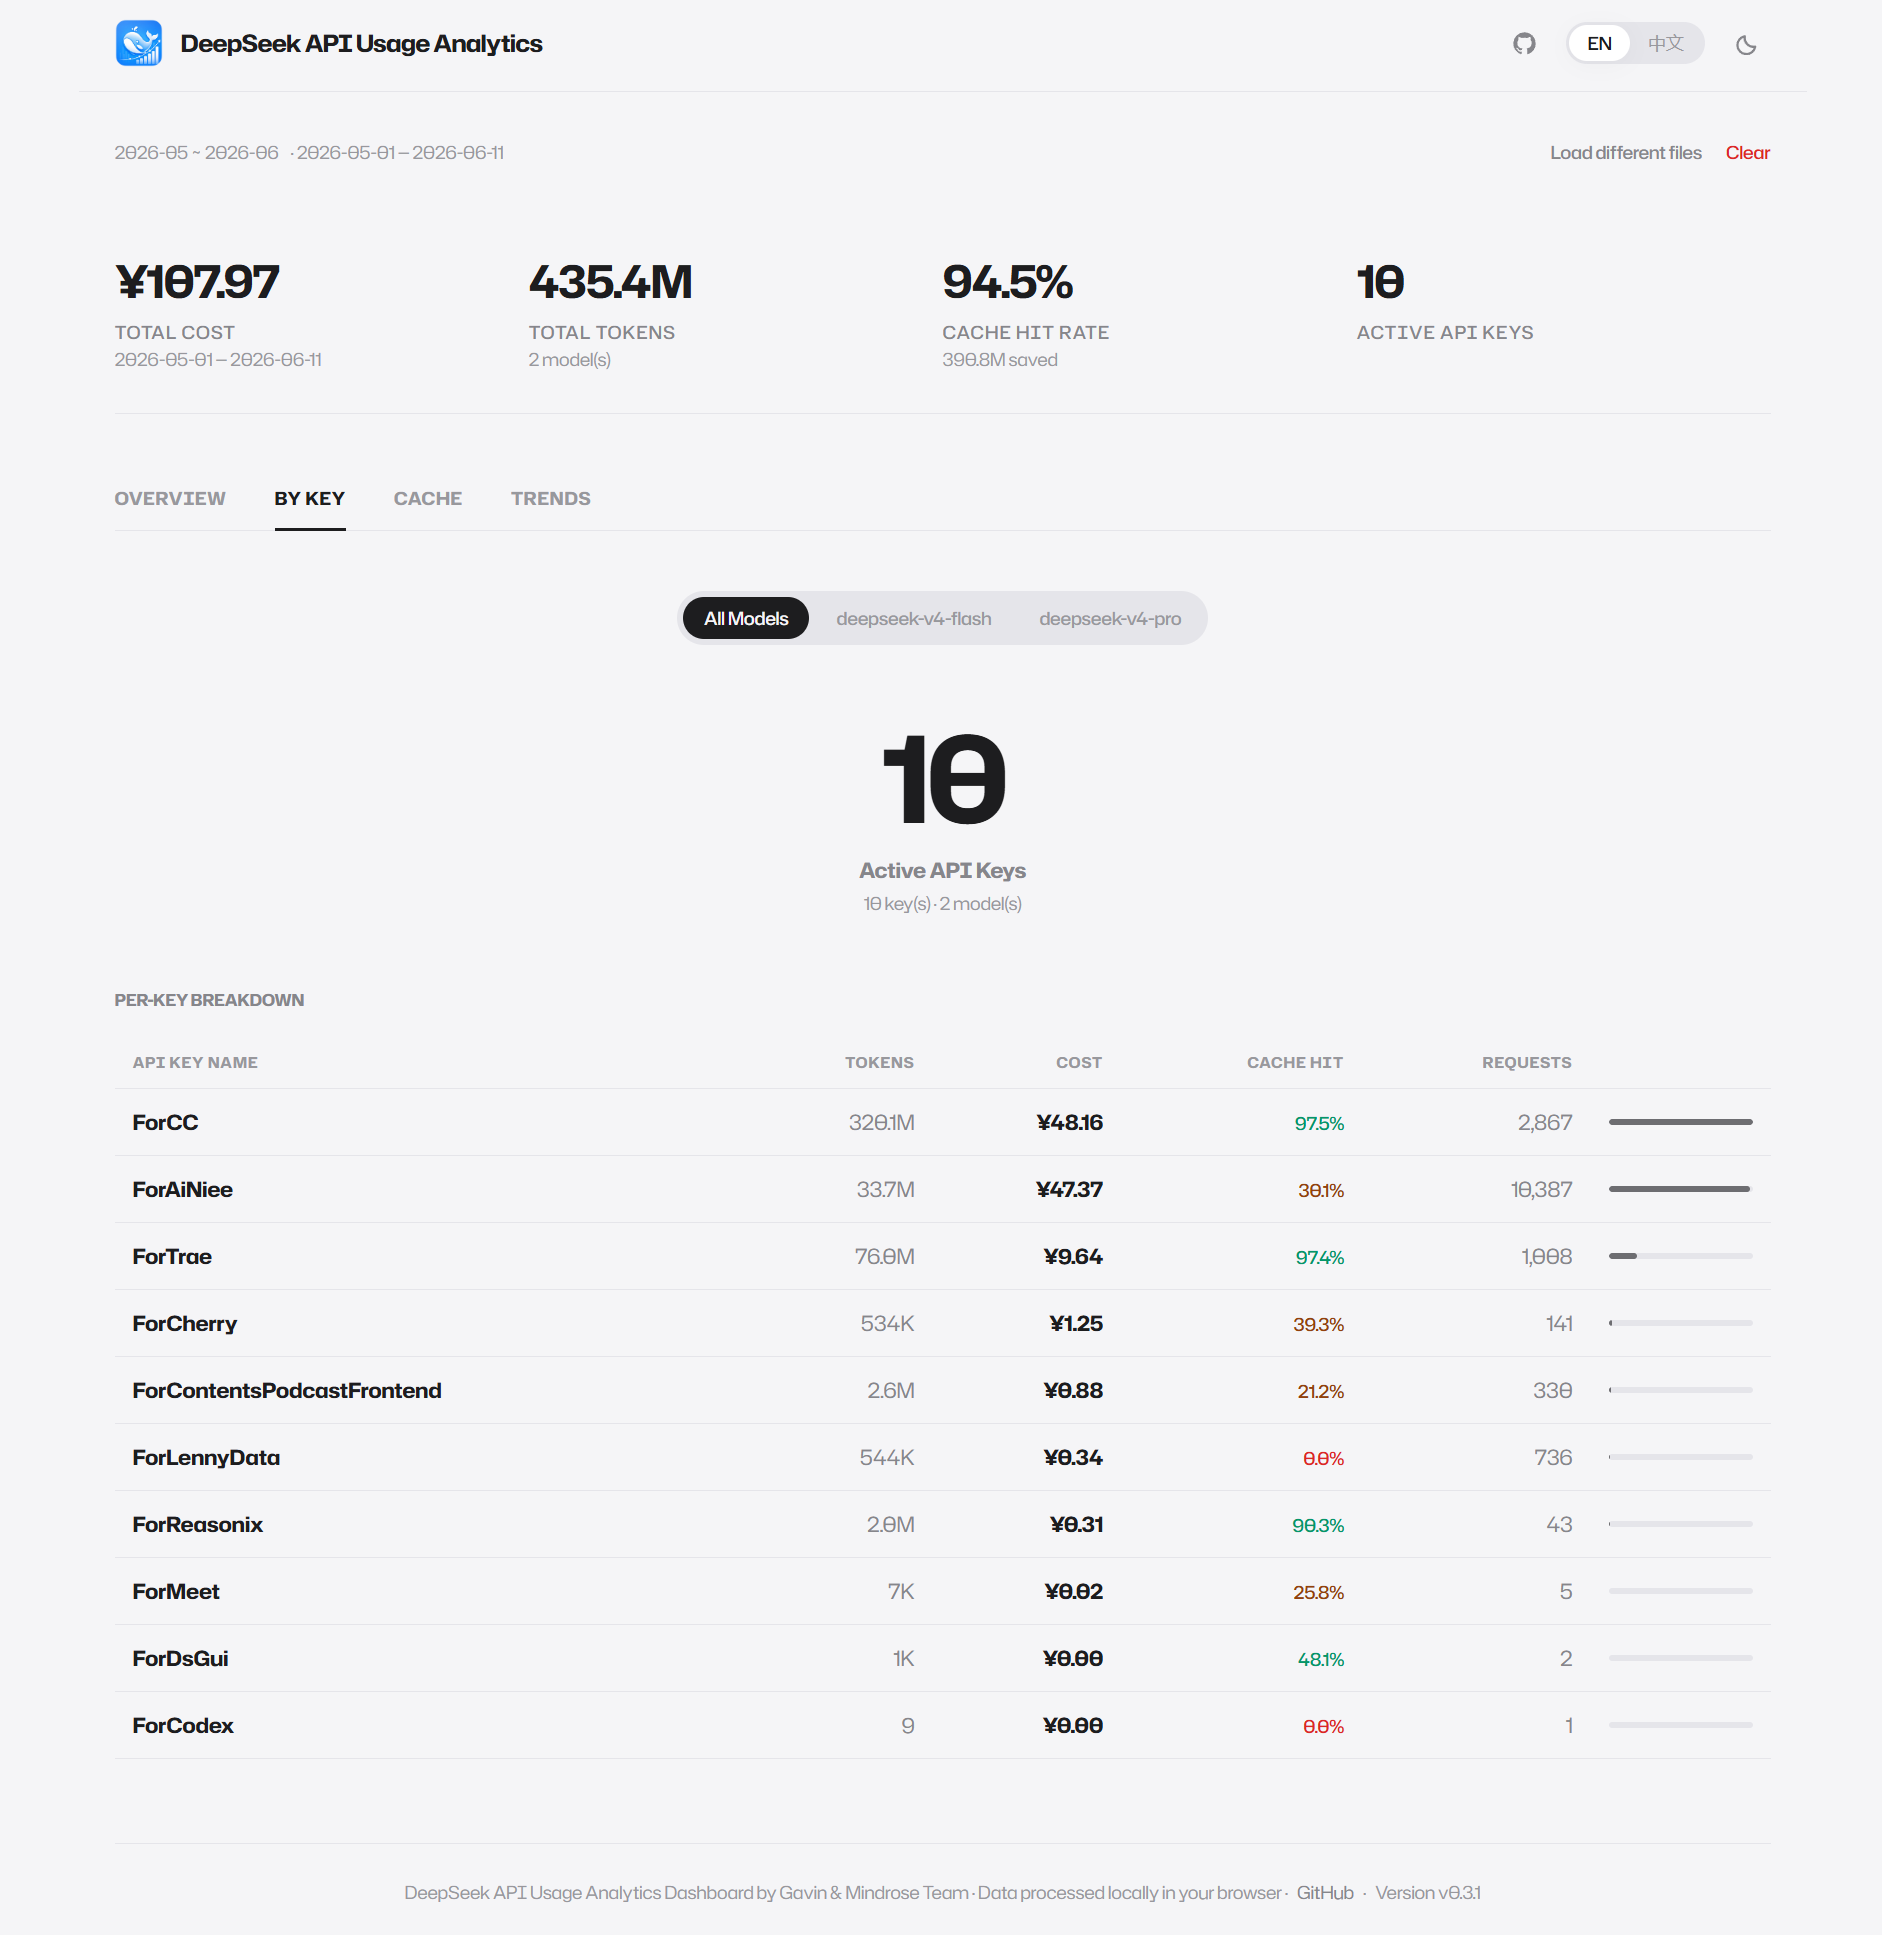
4.6 By Key View
Hero Number
- Large number: Active API Key count
- Label: "Active API Keys"
- Subtitle: Key count and model count
Per-Key Details Table
Full-width table with the following columns:
| Column | Description |
|---|---|
| API Key Name | Primary color, bold |
| Tokens | Secondary color, right-aligned |
| Cost | Primary color, bold, right-aligned |
| Cache Hit | Color-coded: >40% green, 20-40% amber, <20% red |
| Requests | Secondary color, right-aligned |
| Cost Bar | Light background track + dark fill bar, width proportional to cost |
Table rows have a subtle background color change on hover.
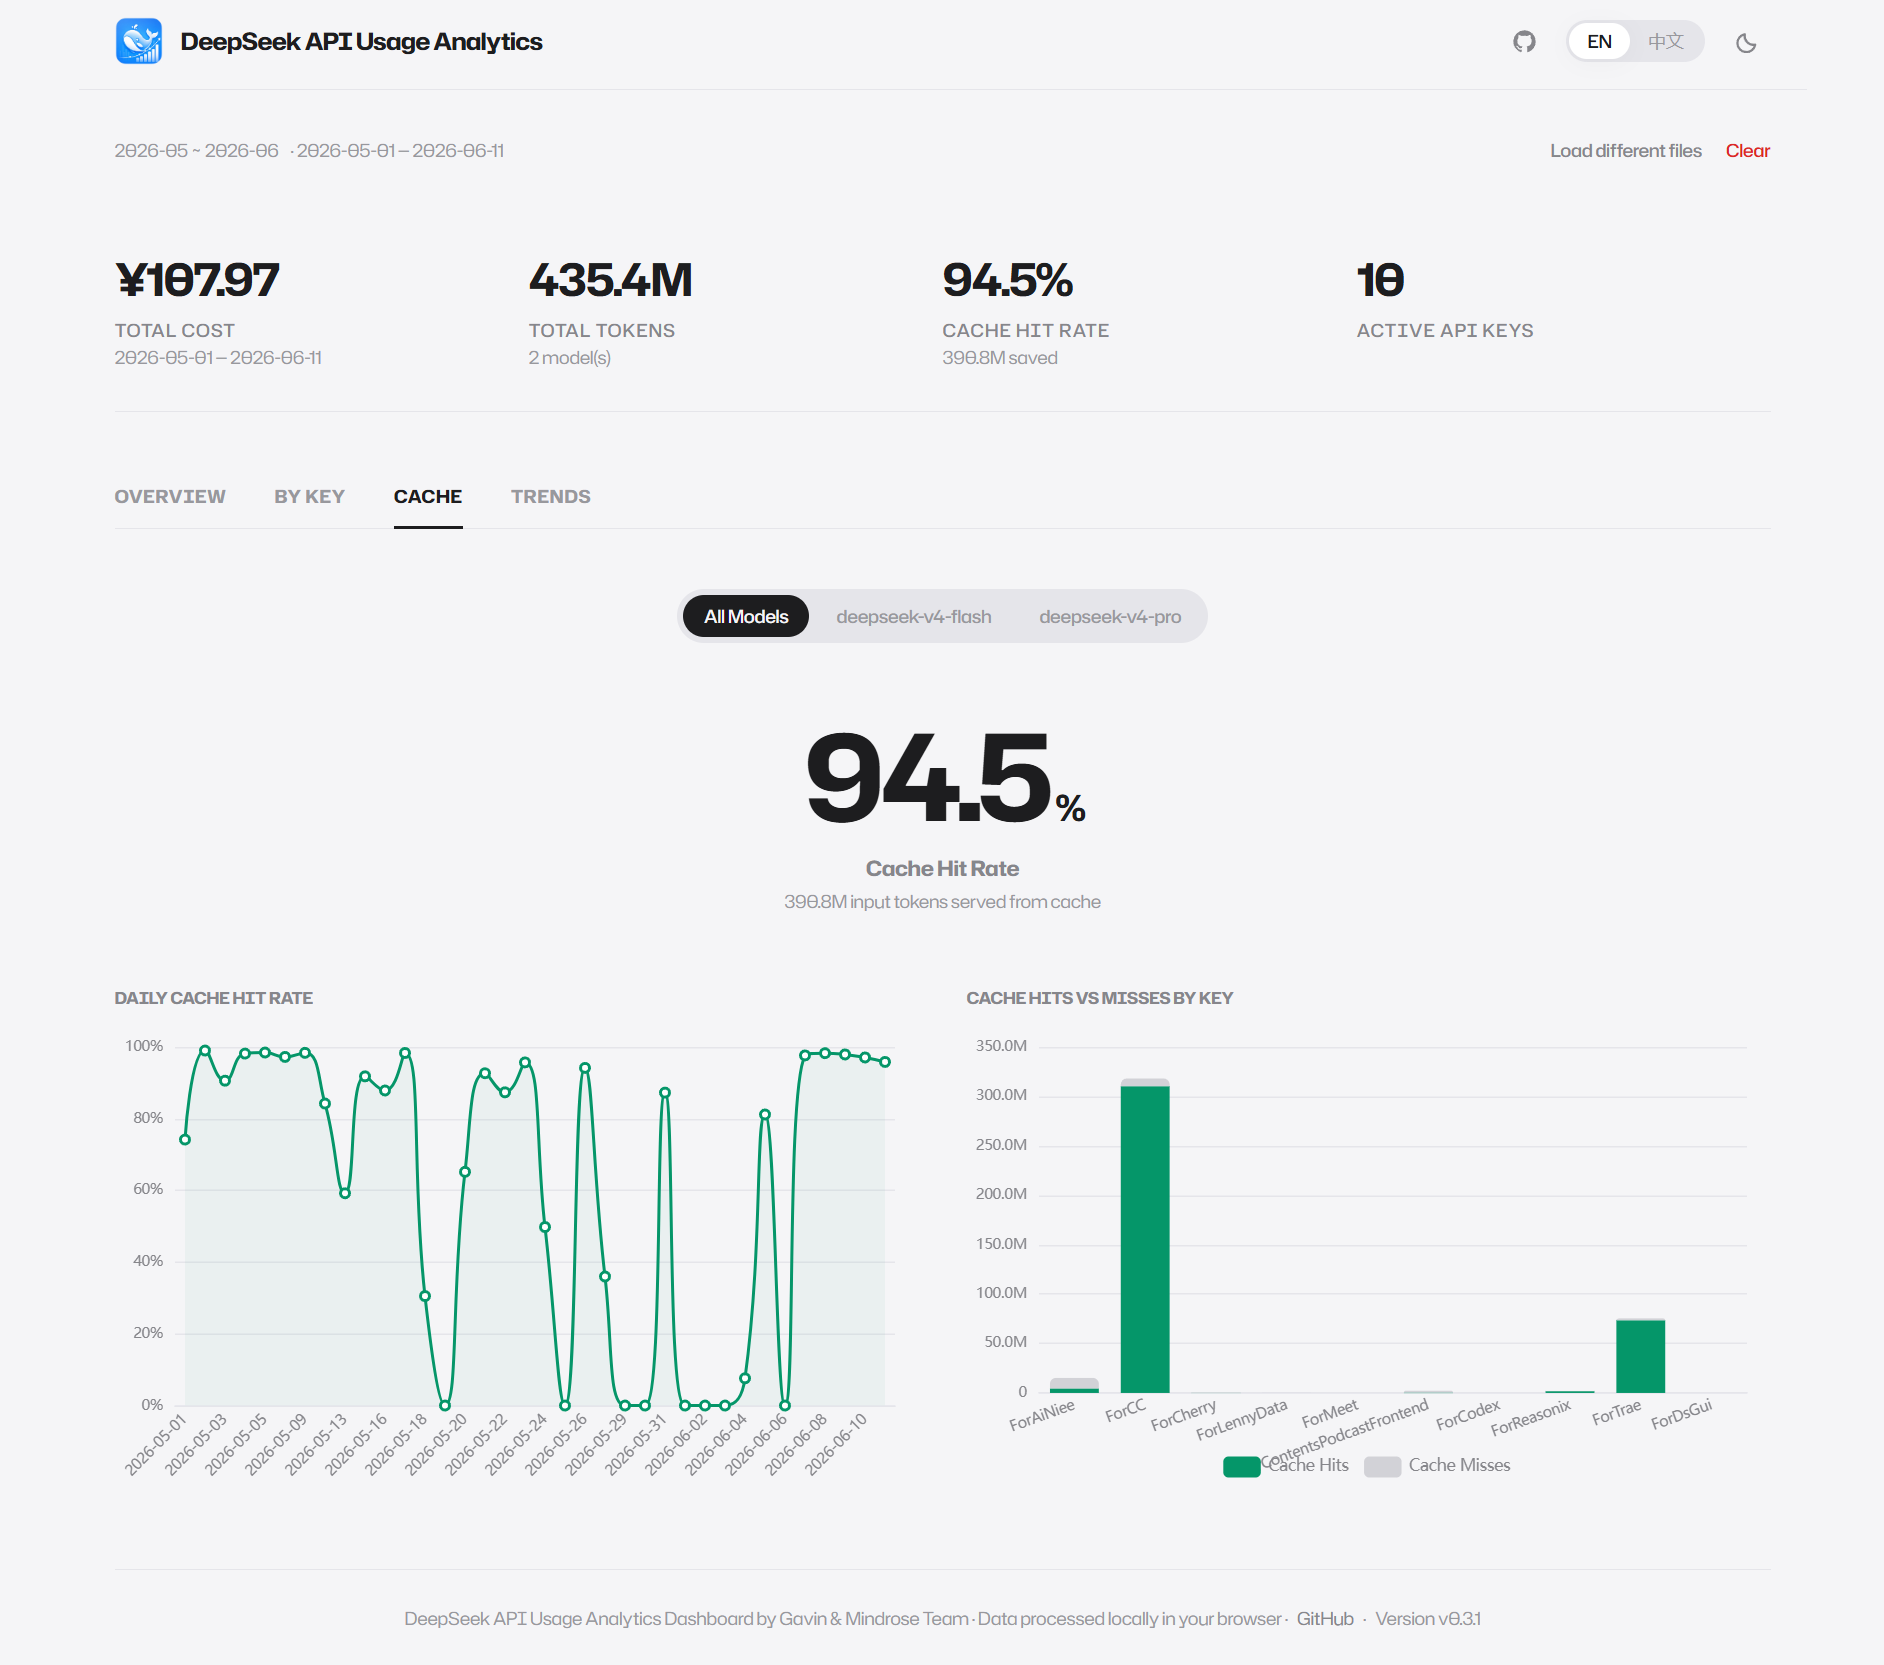
4.7 Cache View
With Cache Data
Hero Number
- Large number: Cache hit rate percentage
- Label: "Cache Hit Rate"
- Subtitle: Token count served from cache
Daily Cache Hit Rate Trend
- Type: ECharts line chart
- Content: Daily cache hit rate trend (0-100%)
- Style: green line + very light green semi-transparent area fill
Per-Key Cache Hits vs. Misses Stacked Bar Chart
- Type: ECharts stacked bar chart
- Content: Cache hits (green) and misses (gray) token counts per key
- Legend: "Cache Hits" and "Cache Misses" at the bottom
Without Cache Data
- Centered icon + "No Cache Usage Detected" title
- "Enable prompt caching in your DeepSeek API calls to reduce costs." hint text
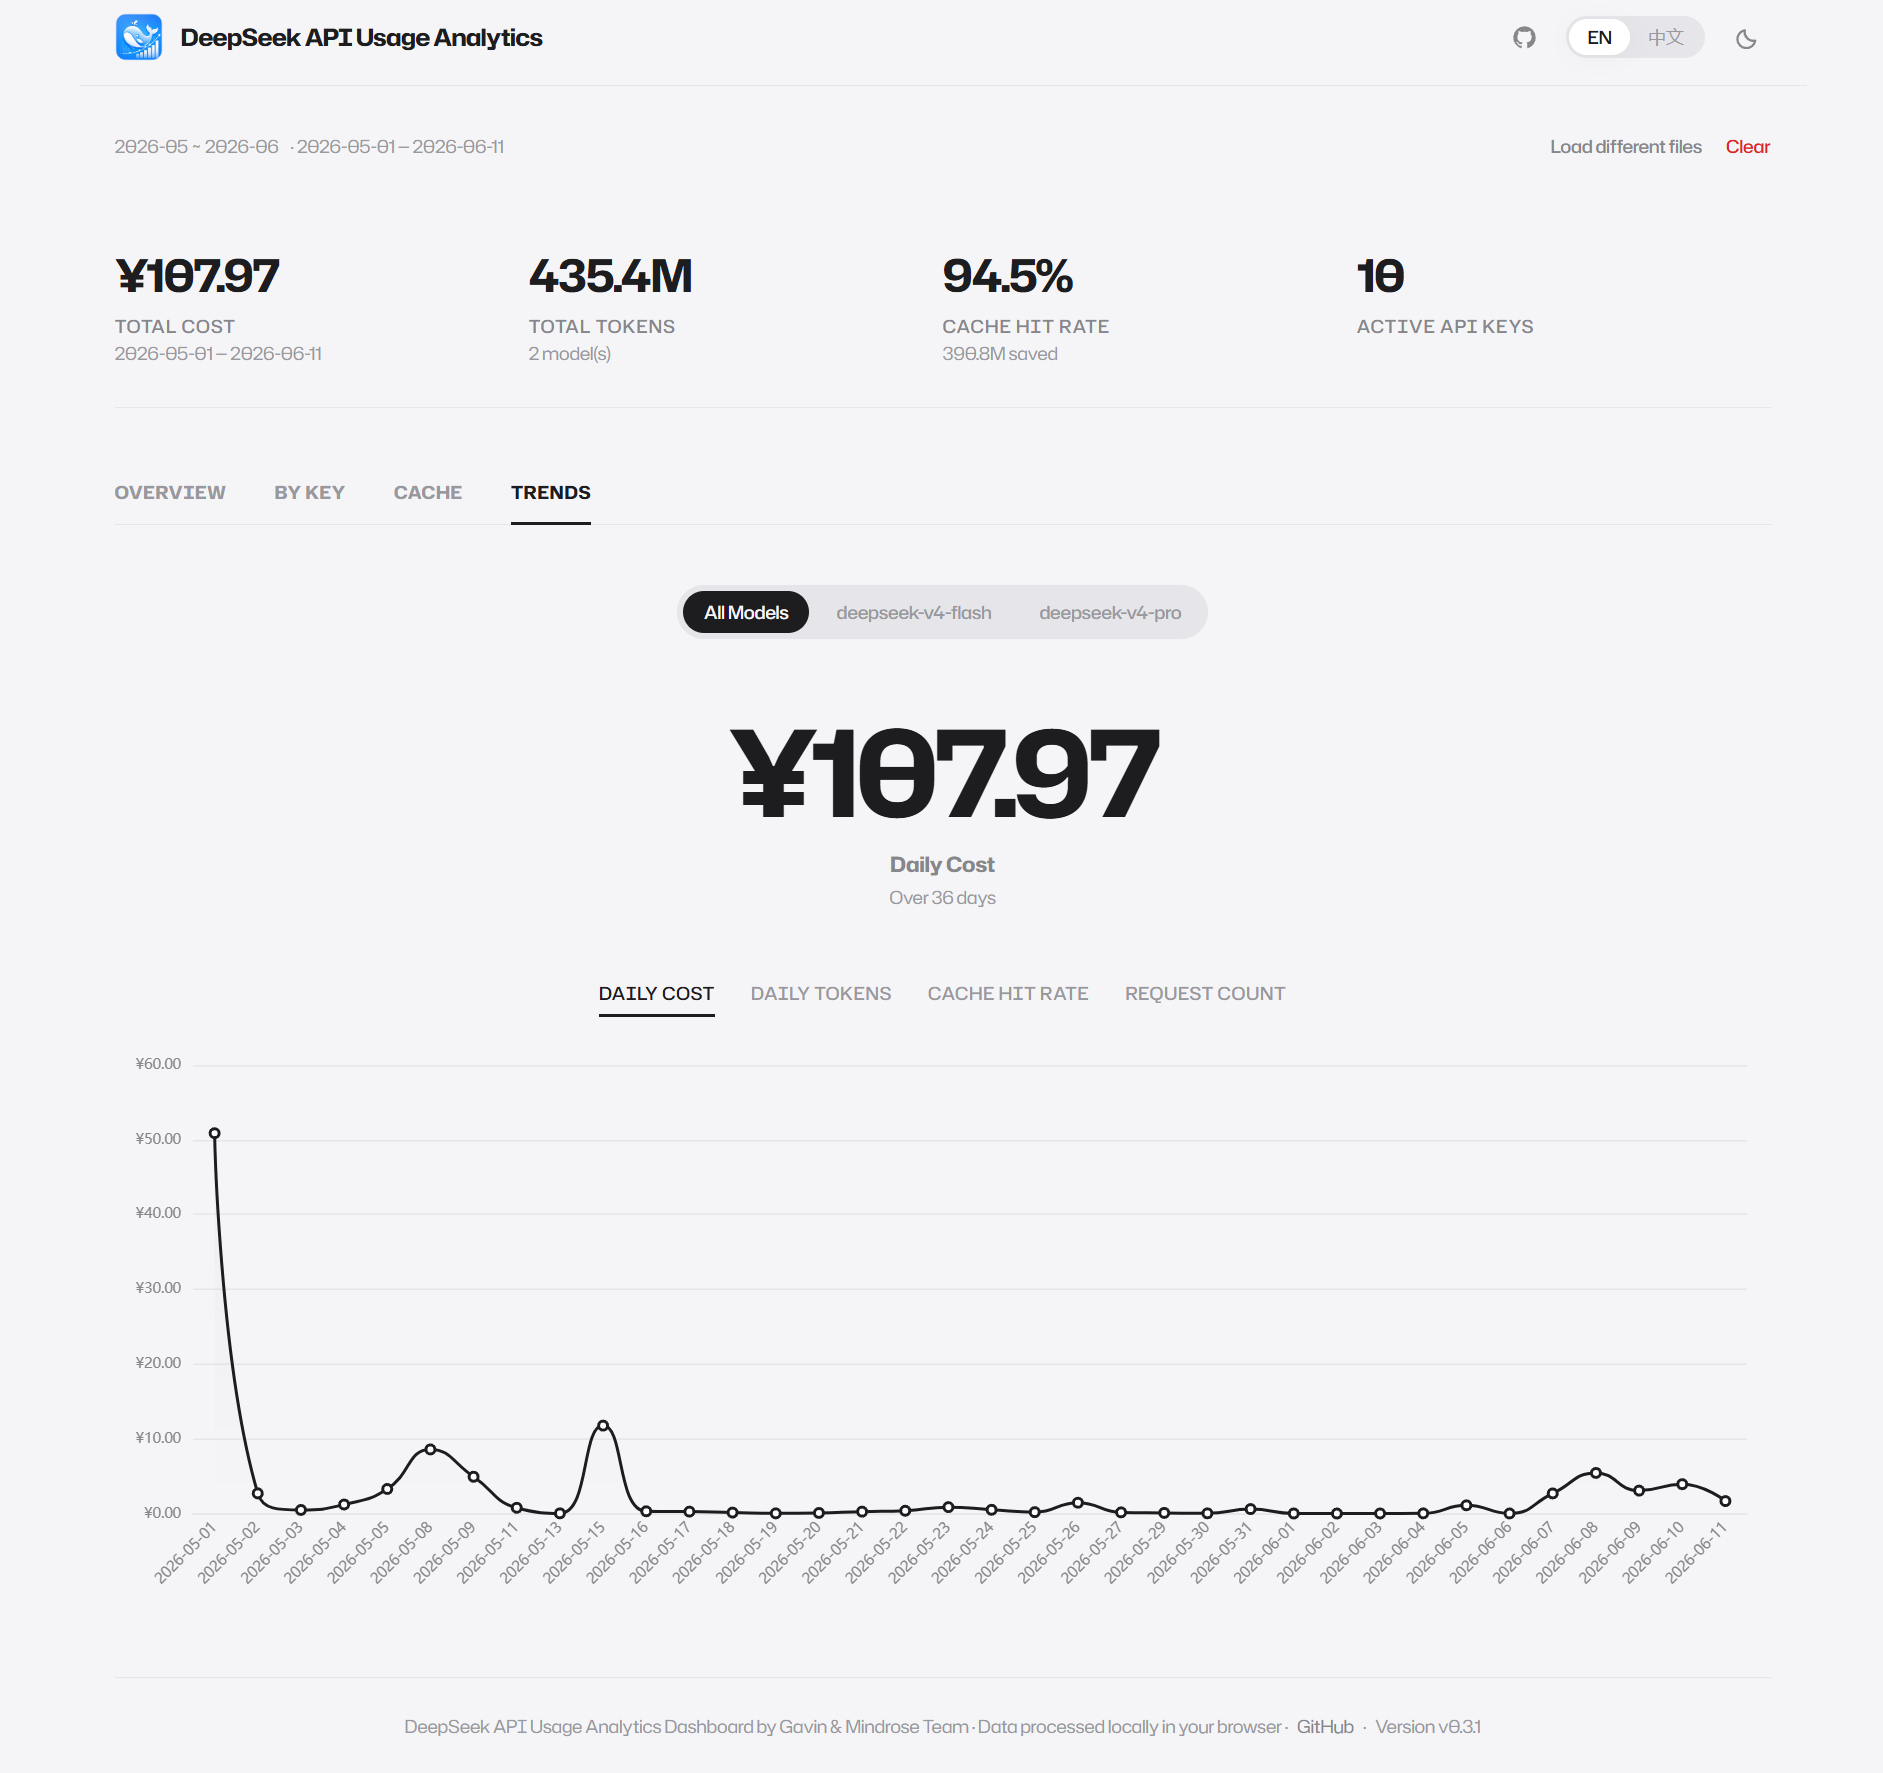
4.8 Trends View
Hero Number (Dynamic)
- Dynamically displays the aggregate value for the currently selected metric
- Format auto-switches by metric type: cost / tokens / cache hit rate / requests
Metric Switcher
- 4 text labels: Daily Cost / Daily Tokens / Cache Hit Rate / Request Count
- Selected label has an underline
- Hero number and chart update synchronously on switch
Multi-Metric Line Chart
- Type: ECharts line chart
- Content: Daily trend for the currently selected metric
- Style: dark line + very light gradient area fill
- Built-in zoom enabled when date range exceeds 30 days
4.9 By Custom Projects View
Group API keys by custom project categories for team-level usage analysis across business lines.
Hero Number
- Large number: Total count of configured projects
- Label:
Projects - Subtitle:
{n} key(s) · {m} model(s), consistent with the By Key view
Configure Button
- Location: Right side of the
By Projectsection title - Icon: Gear icon +
Configuretext button - Click opens the configuration modal
Configuration Modal
- Project list: Each project card contains:
- Project name input (editable)
- Assigned Key pills (draggable, click × to remove)
- Remove project button (trash icon)
- Add Project: Dashed border button, click to add a blank project card
- Unassigned Keys area: Bottom section showing all keys not assigned to any project
- Drag and drop:
- Drag a key from the unassigned area to a project card → assign key to that project
- Drag a key from a project card to the unassigned area → remove assignment
- Drag a key between project cards → reassign
- Drop target highlights on drag-over (accent border + light background)
- Save / Cancel: Save filters out empty-name projects and writes to browser local storage
Data Table
Layout matches the By Key view:
| Column | Description |
|---|---|
| Project | Project name (configured projects = primary color, uncategorized = tertiary) |
| Tokens | Full token count (comma-separated, no abbreviation suffix) |
| Cost | Full cost amount (¥ symbol + 2 decimals, clickable to copy) |
| Cache Hit | Cache hit rate percentage (green > 40%, amber 20-40%, red < 20%) |
| Requests | Request count |
| Bar | Cost proportion bar (semi-transparent for uncategorized items) |
- Uncategorized row: Only shown when it has data, always at the bottom
- Sorting: By cost descending, uncategorized always last
Project configuration is saved in browser local storage with cross-tab auto-sync.
5. Global Features
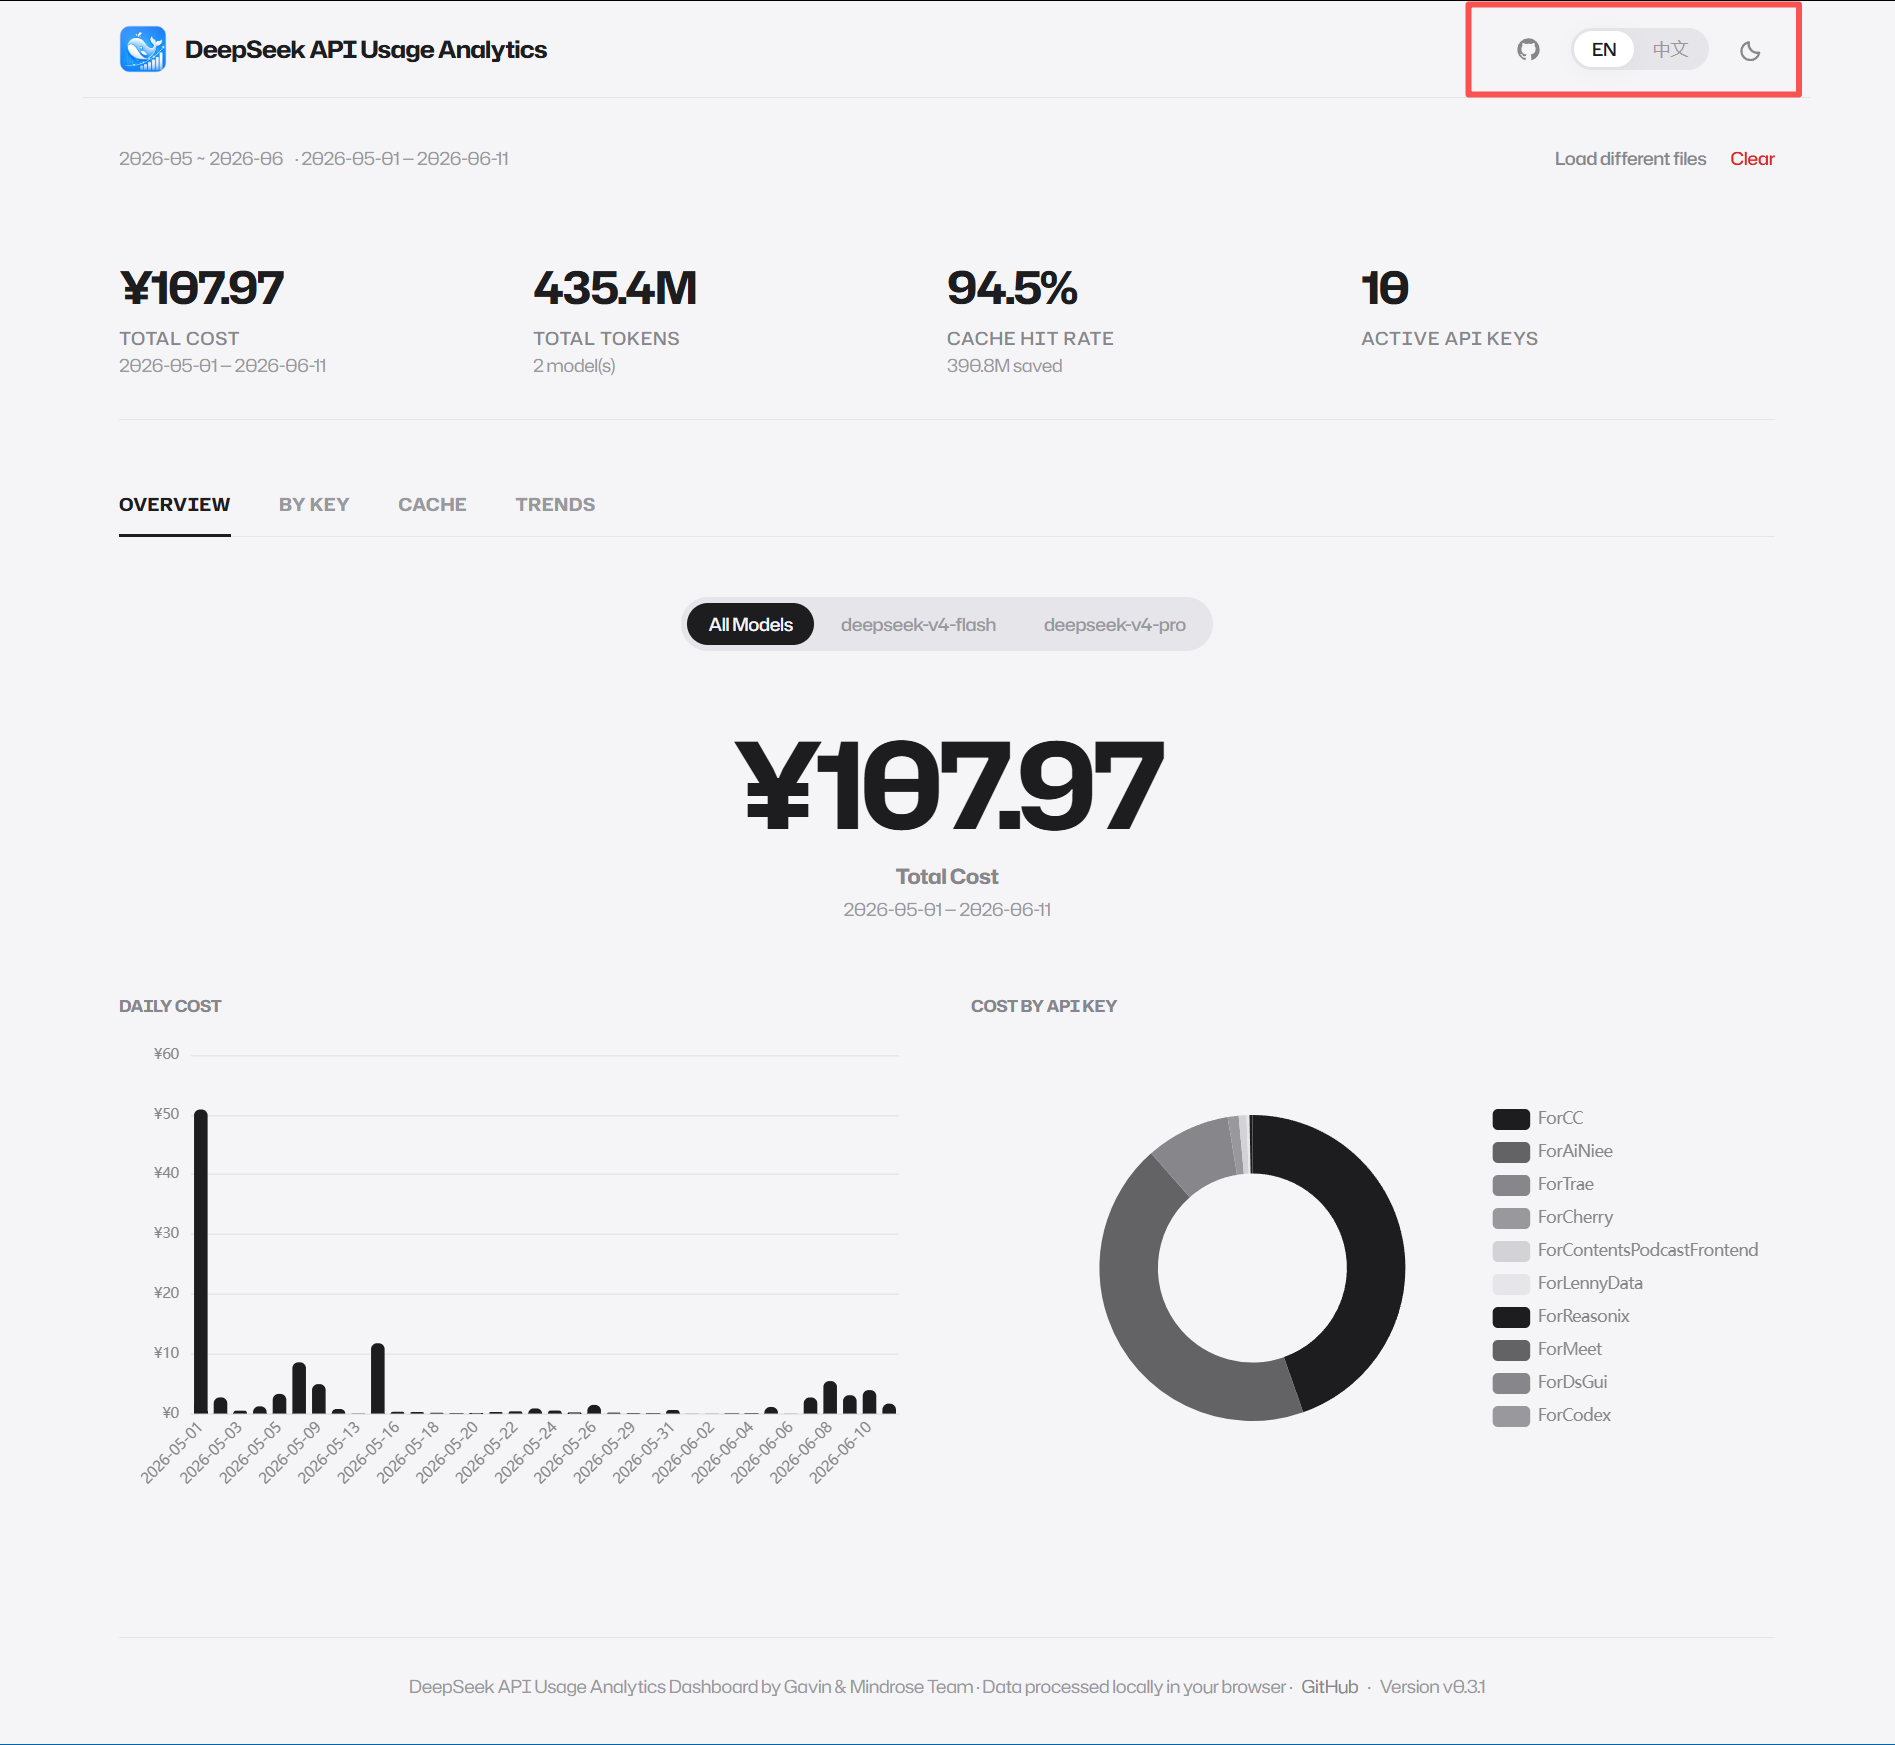
5.1 Language Switching
Location: right side of the top navigation bar, Apple-style pill segmented control.
- EN: Switch to English interface
- 中文: Switch to Chinese interface
Language preference is automatically saved to browser local storage and restored on the next visit. Auto-detected from browser language on first visit.
5.2 Theme Switching (Light/Dark)
Location: far right of the top navigation bar, circular icon button.
- Light Mode: Cold gray paper-texture background, dark text
- Dark Mode: Pure black background, light text
Theme preference is automatically saved to browser local storage, with system preference as the initial default.
5.3 Multi-Month Merge
Supports uploading multiple months of ZIP or CSV files simultaneously. Merge rules:
- If ZIP files are uploaded, the system first extracts the CSV files inside
- The system reads each filename and extracts the year-month key
- Amount and cost files from the same month are automatically paired
- After pairing, all monthly data is merged into a single continuous CSV text for parsing
- The file label automatically updates to the range format
5.4 Social Media Sharing
Each dashboard tab can generate a 1200×630 infographic share image, ideal for sharing on WeChat, Feishu, DingTalk, Twitter, and other social platforms.
Usage Steps:
- In any tab's navigation bar, click the Share icon (node-connection icon) on the right side
- In the popup window, fill in:
- Your / Team Name: displayed as a large "From XXX" signature on the image (required, auto-saved)
- Message: optional, shown as a quote in the top-right corner of the card (with example placeholder text)
- The preview area below shows the card in real time
- Click "Generate & Copy" — the image is copied to clipboard, ready to paste directly into WeChat/Feishu/DingTalk
- Alternatively, click "PNG" to download the image file
Card Contents:
- Top: App name + current tab label + "From XXX" signature + custom message (if any)
- Left: Tab-specific core metric (Overview=Total Cost / Projects=Project Count / Keys=Key Count / Cache=Hit Rate / Trends=Total Cost) + KPI values
- Right: Mini ECharts chart corresponding to the current tab (bar/line/horizontal bar)
- Bottom: Date range + App Logo + QR code (pointing to deepseek-usage.xyz) + brand watermark
6. CSV File Format
Amount CSV Format
| Column | Description |
|---|---|
utc_date | UTC date |
model | Model name |
api_key_name | API Key name |
api_key | API Key value |
type | Type enum |
price | Unit price (empty for request_count type) |
amount | Count |
Cost CSV Format
| Column | Description |
|---|---|
utc_date | UTC date |
model | Model name |
cost | Cost (daily total) |
currency | Currency unit |
Notes
- Files must be UTF-8 encoded
- Column names must match exactly (case-sensitive)
- Optional columns are ignored and will not affect parsing
7. Privacy & Security
| Aspect | Description |
|---|---|
| Data Storage | CSV file contents are processed only in browser memory — never written to disk or uploaded to any server |
| Network Requests | The entire app is a static site — aside from loading page resources initially, no data upload requests are made |
| Third-Party Dependencies | All dependencies run in the browser and do not transmit data through external APIs |
| Open Source Transparency | The project is fully open source (GitHub) — anyone can audit the code and verify privacy claims |
8. Troubleshooting
| Issue | Possible Cause | Solution |
|---|---|---|
| No response after upload | File is not CSV or ZIP format | Ensure file extension is .csv or .zip — do not upload Excel or PDF files |
| "File too large" warning | A single file exceeds 50 MB | Normal DeepSeek monthly exports are typically under 1 MB; check if you selected the wrong file |
| "CSV Format Not Recognized" | Column names don't match or file is corrupted | Export from the official DeepSeek Platform; do not modify ZIP contents |
| Cost shows as 0 | Missing cost CSV file | Ensure the ZIP contains both amount and cost for the month, or upload the missing file separately |
| ZIP upload has no effect | ZIP contains no CSV files | Ensure the ZIP archive contains .csv files — do not upload archives with only other formats |
| Missing data for a specific day | No API calls on that day | Normal behavior — does not affect other days' data |
| Cache view shows "No Cache Usage Detected" | Prompt caching not enabled in API calls | Enable prompt caching in your DeepSeek API calls |
| "Incomplete Upload" shown | A month has only amount or only cost file | Add the missing file and re-upload |
| Data anomalies after multi-month merge | Non-standard filename format | Ensure filenames inside ZIP or directly uploaded CSVs follow the standard pattern |
This document is updated with app releases. For questions or suggestions, please reach out via GitHub Issues.